For a few posts now I've been talking about the AirPi, an environmental monitoring platform for the RaspberryPi. At the end of thesetwo posts, I made the point that while it's great that I've got output from the AirPi it doesn't mean much if I don't know what it means. Today I'll be going through the output (below) and looking at the sensor specs in more details to get an idea of what the numbers mean. Apologies for a potentially boring very texty post.
Temp-DHT:       26.1 C
Humidity:       35.7 %
Air Quality:    16920.56
Light Level:    4.91 Lux
UV Level:       0.48 UVI
Temp-BMP:       25.6 C
Pressure:       97912.6 Pa
Time: 2014-02-11 20:37:56.611572
Temperature: 32.4 C
Pressure: 977.71 hPa
Relative_Humidity: 25.7000007629 %
Light_Level: 7698.96193772 Ohms
Nitrogen_Dioxide: 7607.57314974 Ohms
Carbon_Monoxide: 301176.470588 Ohms
Volume: 90.3225806452 mV
Uploaded successfully
The DHT22 (humidity)
This is the combined temperature moisture probe. It's an Adafruit special, which means I can start there for learning more. The datasheet is of course another good source. The two important bits from the Adafruit page are these two pieces of information:
- Good for 0-100% humidity readings with 2-5% accuracy
- Good for -40 to 80°C temperature readings ±0.5°C accuracy
A responses range of 0% to 100% humidity means that it's OK to put a DHT22 pretty much anyplace other than a rainforest. A rainforest, and anyplace else extraordinarily wet is a no go because checking the datasheet that's 100% Relative Humidity (RH). (See this for a bit more about humidity. Effectively once the air is super-saturated for the temperature we're over 100% RH and so the sensor won't be very happy.
Some good news is that the data sheet says this:
- Calibrated digital signal
- Fully interchangeable
Nominally then every sensor is identical and should give the same reading given identical conditions. In practice this is very rarely the case. We know this for sure given the "2-5%" accuracy claim. Reading the datasheet again, this comes across as typically ±2% accuracy, with a maximum of ±5%. In most cases then the reading should be fairly accurate. Because the sensor is digital, there's also no need to take into account anything in the circuit, so we don't need to do anything to the values produced by the software.
The sensor resolution is tenths of a percent (see the 35.7% of above). Based on ±2% accuracy, this number could be anywhere from 33.7% to 37.7% RH. Hopefully sensor error falls along a normal distribution, meaning that if we collect data on trends over time, something like a moving average will give a more accurate reading by averaging out the effect of errors. The moral here is don't be lulled by that extra 0.1% humidity, that on its own won't make a difference.
Repeatability is another factor to consider, independent of accuracy. The datasheet says ±1%, which means sequential readings given identical conditions will still vary some. Then there's long term repeatability. "Long-term stability" is in the datasheet as ±0.5% a year, so given identical conditions today and a year later, there could be a slight difference in RH, no matter what. There's also something called hysteresis, which is ±0.3%. This one's a bit tricky to explain. If the humidity was rising, the reading of 35.7% could have a different meaning than if the humidity was falling. In either case the value could have been anywhere from 35.4% to 36.0%.
You may wonder what's the point of having a sensor resolution of 0.1% RH if the accuracy means it could practically be any old value. Imagine if you had 10 of these, all measuring. That extra resolution could be used to narrow down what the humidity was if you looked for a value that fell into the range of all the accuracy windows of all the sensors. Plus it's not impossible that an increase in humidity of 0.1% wouldn't be detected, you just need to take it with a grain of salt.
Considering the temperature side of the DHT22 some more, the accuracy, resolution, and repeatability are all much better at ±0.2°C, 0.1°C, and ±0.2°C according to the datasheet. I'm not quite sure where Adafruit got ±0.5°C, but I'm inclined to go with the datasheet. There's no stability or hysteresis listed, so it looks like the temperature readings should be fairly accurate and consistent over time.
The TGS2600
This is the combined Air Quality sensor. It's analogue so it goes through the AirPi's Analogue-to-Digital Converter (ADC). We need to understand a bit more about the electronics and AirPi software this time to understand what the value of "16920.56" means. Looking through the data sheet gives us this formula:
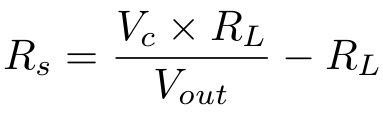
Where Rs is sensor resistance, Vc is sensor input voltage, Rl is load resistance, and Vout is measured sensor voltage. Looking through the AirPi code, we see this:
resistance = (vin/result - 1)*self.pullupYou may notice that if you multiply self.pullup inside the brackets you end up with the formula for the datasheet. You find if you follow the variables in the code and do comparisons of the AirPi circuit diagram and the "Basic Measuring Circuit" diagram in the datasheet, that we're looking at the same things. So that value of 16920.56 is the Rs value, or the resistance across the TGS2600 sensor.
The next question then now that we know exactly what 16920 is, is what does it mean? For that we have to know what the TGS2600 is sensitive to. It says right at the top of the datasheet "for the detection of Air Contaminants" but we can be a bit more precise than that. They specifically list sensitivity to methane, carbon monoxide (CO), iso-butane, ethanol, and hydrogen. Of course how they do this is a bit round about. They do it by showing this graph:
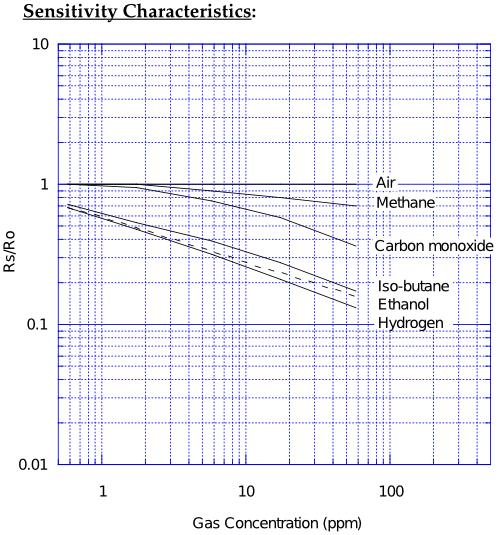
This shows a link between the concentration of the different chemicals in parts-per-million (ppm)—ppm can be thought of like percent, except for one in one million rather than one in one hundred. It gives us this information in relation to "Rs/Ro", which is the ratio of sensor resistance, which is what the AirPi actually measures to "sensor resistance in fresh air". Which is unfortunate. This tells us the sensor really needs calibration with fresh air before we have a meaningful reading. How else do we know what the resistance in fresh air is? And even then, we still don't know what gas has caused the quality to drop. 50 ppm of CO or 4 ppm of iso-butane?
But wait! There's more! Next to the graph on sensitivity characteristics there's this beauty:
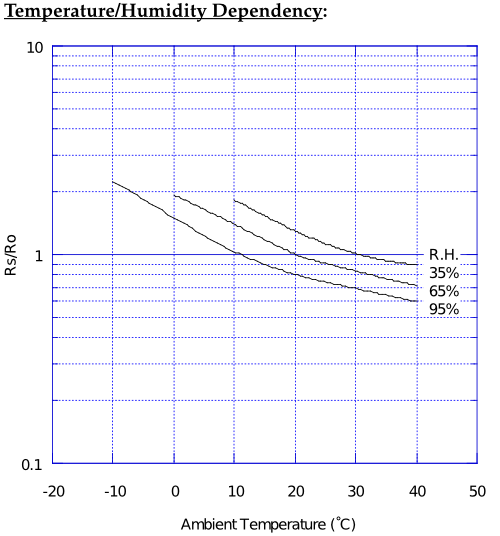
So not only does the sensor react to air quality, but humidity and temperature as well. This actually isn't that uncommon, but means a correction factor needs to be applied to each reading. Happily the DHT22 can be used to work this out. Say it's 30° out at 50% RH. We read across the x-axis, then interpolate halfway between the 65% and 35% lines to tell us that in fresh air Rs/Ro would read just over 0.9, so call it 0.91. We need to divide the Rs reading by this value to correct it to what it would be at the standard 20°C 65% RH they used for the sensitivity graph.
The need for calibration and taking into account temperature and humidity is discouraging, but the sensor can still give useful information. Someone using the data from it simply needs to be aware of these things so that he doesn't draw incorrect conclusions. For example at the very least the temperature and humidity corrections should be applied. The fresh air calibration probably isn't really necessary given that you don't know what gas is affecting it. I suspect though that it can be worked out approximately by looking at a long data series that has been corrected for temperature and humidity. The peak Rs value measured is probably the "fresh air" quality, or a "close enough" guess.
You may notice that I haven't said anything about accuracy for the TGS2600. That's because the datasheet doesn't say much about it other than 10 ppm H2 (that's hydrogen). The DHT22 also had an on-board analog to digital conversion that in this case is being handled by the ADC, which I think has a high enough resolution that's it's a non-issue. All things considered I suspect that the ultimate lack of reliable calibration means that accuracy is a non-issue. Just take the reading with a grain of salt and remember to correct for temperature and humidity.
The Light-Dependent Resistor (LDR), GL5528
This one, I have to admit before actually looking into it, I thought was going to be meaningless. Mostly because I remember playing with an LDR when I was about 8 to turn lights on and off in the dark of my closet. Because of that I just could not see how you could use an LDR to get to a Lux reading. (Lux is the standard light measure, the same way that meters are for distance.) However, looking at the GL5528 datasheet I was surprised to find that there actually is a proper relationship between resistance and lux, or illuminance.
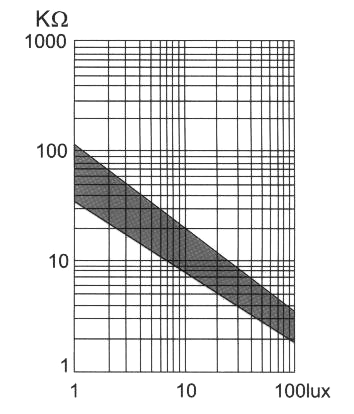
On a log-log graph, there's an approximately linear relationship between the two which means that if we calculate the resistance of the LDR, we can estimate the lux fairly reliably. I use qualitatives like "approximately" and "fairly" because there's that gray region on the graph—the relation can be anywhere in there. That's quite the potential error in there, and the darker it is the greater that uncertainty is due to the log-log scale. We can still approximate things though and hope for the best.
Now how to do that approximation. Looking in the AirPi code I downloaded that matches the directions:
rs = ((3.3 - vout) / vout) * 5.6To which I say, "what?", because that's the code that produces the lux number of "4.91 Lux" I posted above. I believe that's just plain wrong, because there's two things wrong here. There's nothing taking into account the pull-up resistor of 2.2KΩ for starters. The 5.6 I could imagine to be a calibration co-efficient, and I suppose that nominally it could take into account that resistor, but then what takes care of the log-log relation ship? I'd expect to see either an ln() or an exp() because of that. It could simplify all of that in as I haven't worked through the math there yet, but for the same reason a teacher doesn't like it when you don't show your work, I'm confused. So I set out to work out what's going on.
The first thing I do is check the code that goes with the updated hardware revision and see this:
resOut = self.pullUp/((vin/vout)-1)Ah ha. This looks better, more like what we say for the TGS2600 above when we were calculating resistance, except in this case it's a one-over (as in one divided by) relation. This makes sense because it's a pull-up instead of a pull-down situation (vin and vout are reversed). On a side note, this sort of calculation is called a voltage divider. Anyway, when the new software says "7698.96193772 Ohms" for the light sensor that's exactly what it is. It still needs to be converted to lux, but at least it's clearer that this is the case.
The conversion should therefore be pretty straightforward (once the wacky math on the older software is reversed and the correct resistance value obtained). It is too, after wrapping one's head around the log-log. Fortunately the fact that it's log-log works for us, making it easier to deal with. Essentially we can treat it as a regular linear plot of y = mx + b, but replacing y and x with ln(y) and ln(x) (natural logarithms). At which point it's only a minor nuisance to fire up Matlab (or Octave) and use polyfit() to work out a linear regression after reading some values off the graph:
>> polyfit(log([1 2 100]), log([60 40 2.8]), 1)

ans =

   -0.6704    4.1215
Plug that into y = mx + b:
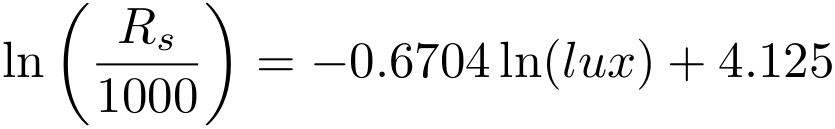
Apply some algebra and rearrange to solve for the lux value given resistance:
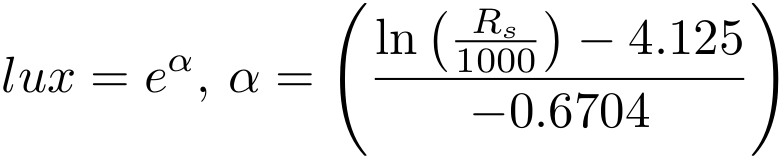
Viola! This should give me a value that I'm confident reflects reality somewhat. (Rs is divided by 1000 because the y-axis of the graph above has KΩ for the units.) I've undoubtedly introduced some error by reading off values from the graph, but this could be compensated for by adding more values. I suspect that won't have much of an impact though. Overall I wouldn't use this or the LDR for life or death situations, but it's close enough. Keep in mind that if your LDR isn't a 5528 then the function above probably won't be correct anymore and should be recalculated off the appropriate datasheet.
UV sensor UVI-01
Really, I think this is one of the coolest bits of the AirPi and I think it's a shame it's missing from the newer hardware revision. I suppose I can see why you might replace it with a microphone, but really, UV. How awesome? A measure of direct sunlight intensity. Potentially something there in calculating evapo-transpiration, a key part of catchment models. (So that you know how much rain water can be sucked into the ground!) Also used for working out how much to water crops.
Right, the sensor. I have no idea electrically how this thing that looks like an LED is an LED in reverse, but the rest of it makes some sort of sense. It had better given that last time I spent a good while working out that I plugged it in backwards. What that means though is that when I see this:
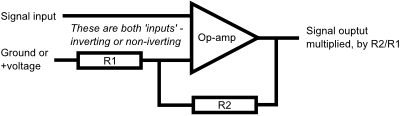
sensorVoltage = vout / 471
millivolts = sensorVoltage * 1000
UVI = millivolts * (5.25/20)
It actually makes sense. Why divide by 471? That's because that's the ratio of the two resistors around the CA314 op-amp. According to the directions you're supposed to use a 10KΩ and a 4.7MΩ for R1 and R2 respectively, that's a ratio of 470, or the amplification ratio. It's specifically that ratio that's important so you could essentially use anything in the 1KΩ to 30KΩ range for R1 as long as R2 was 470 times greater. Can't make 470 times? Edit that line of code with the 471 divider. (I used 1KΩ and 470KΩ, because the Maplin resistor kit doesn't go over 1MΩ.)
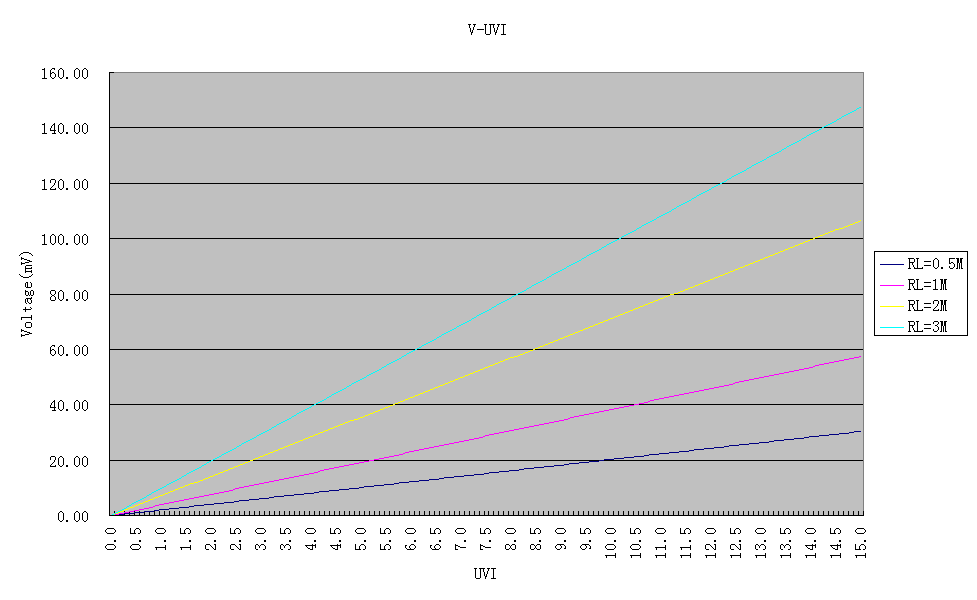
Then why multiply by 1000? That's to get the reading in mV. Because unlike the previous sensors, which measure by resistance, the UVI-01 is a direct voltage reading. Which is why the third line of code there is a multiplication by a factor. That's a factory standard calibration. You can see it in the following graph from the datasheet:
 Click for a graph you can actually read...
There are four very linear lines, for 0.5MΩ, 1MΩ, 2MΩ, and 3MΩ, resistor put in parallel with the UVI-01. The AirPi directions follow the factory recommendation and use a 1MΩ resistor. It's just a matter of reading off the purple lines to get the 5.25 and 20 as the slope of the line, it's very convenient as there's no y-intercept. Just read over and down from the 20.00, and there we have it. A very nice, easy sensor to read with what appears to be a fairly reliable direct reading of UV Index, or UVI.
There's just one caveat—"Inaccuracy: 15%". So given higher levels of UV, i.e., when it's more critical, the accuracy goes down. At least, that's how I read it. So on normal day with a UVI of 5, it could be somewhere between 4.25 and 5.75. That window gets bigger at higher readings. Although to be fair, if we actually look at the scale on that nice Wikipedia link, at higher values of UVI, we'd be roasting to a crisp anyway, no matter the accuracy.
Simply knowing the UVI value is up there is enough. Given we know about the inaccuracy though we can stick some error bars on there and be informed. It's still probably more reliable than a TGS2600 or an LDR because it doesn't require a specific calibration. Full steam ahead for knowing when you need sunblock!
BMP085 pressure sensor
Another Adafruit favorite. I immediately like it for another reason: "Fully calibrated". What they do is they run a calibration of the sensor in the factory and burn the calibration co-efficients into the chip. When the AirPi software reads the value off the pressure transducer, it then applies this in-built calibration. We can therefore be reasonably confident in the value being obtained.
Provided we're aware of the inherent sensor accuracy and resolution. In this case the datasheet says typically ±1.0 hPa with a maximum of ±2.5 hPa for pressure between 700 and 1100 hPa between 0°C and 60°C. This gets a bit worse at even lower pressures (300 to 700 hPa a maximum of ±3.0 hPa) and temperatures (300 to 1100 hPa at -20°C to 0°C typically ±1.5 hPa and a maximum of ±4.0 hPa). For the temperature readings that the BMP085 takes we're looking at typically ±0.5°C with a maximum of ±1.5°C. (This is a little bit worse than the DHT22.)
The BMP085 also has one other interesting setting, which is oversampling. ("mode" in the AirPi software.) The sensor in this case can be told to take multiple readings internally and return an average value. Because they're very close in time the assumption is that they're effectively the same reading (i.e. the pressure won't have changed much) and so averaging will cancel out any other effects that would introduce noise into the pressure reading. By default the AirPi uses the setting that averages 2 readings. The sensor is capable of doing a maximum of 8 readings internally, but there's a penalty in time and power consumption for doing this. The latter probably has more impact because the software isn't running as quickly as 25 ms resolution (the time for 8 readings).
So taking this all into account, the temperature reading won't be so good, but the pressure reading should be excellent. Remember that standard atmospheric pressure is 1013.25 hPa, which means that ±1.0 hPa is actually ±0.1%. As pressure gets lower that becomes a slightly higher fraction, but even under the worst of conditions (cold weather and low pressure) we're still only talking about ±0.5% error or so. I feel here Bosch lives up to the brand name recognition and delivers a good product. It's similar to the feeling I got using GE Sensing PDCR 1830 Druck Pressure Sensors in academic research. (Although there it's ±0.06% error!)
The next thing is to talk bout how the AirPi software uses the data from the sensor. The data sheet suggests two uses and both are implemented in the AirPi software. The first is to use the pressure to calculate the altitude. The higher up you are the lower the pressure will be and this expresses as an exponential function:
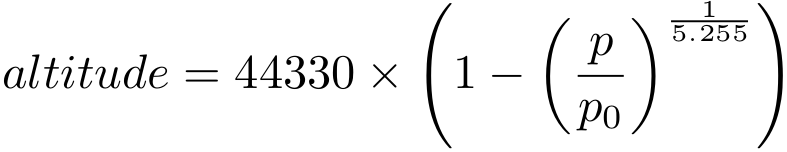
Here p0 is pressure at sea level, so 1013.25 hPa and p is the pressure reading from the sensor.
The second use is to calculate the pressure at sea level given a known altitude:
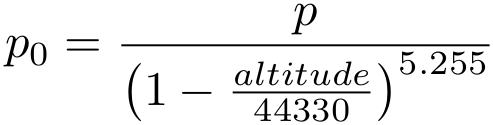
It's the second of these which is used by default in the AirPi software, assuming an altitude of 35 m above sea level. Sheffield is a hilly place and as a result altitude over the area actually varies quite a bit. I think my house is a bit higher given that when the AirPi says 98.2 hPa, the barometer on my wall reads 97.1 hPa. Which brings me to my point here: I'd rather have the pressure reading as is, just like the wall barometer. While the sensor is accurate enough to give a precise pressure reading, the readings are really only interesting to me for the trends they show. That is to say, to help me predict the weather! (Typically low pressure = bad weather, high pressure = good weather.)
The rest of the sensors
I've only gone through the sensors I have on my AirPi breadboard. I leave the remaining microphone, NO and CO meters, as an exercise for the reader. Or another later article. What I have here is enough so that in a post or two I can look at my data and see what there is to see.
Summary
There are two major things of interesting in a monitoring setup like this. What's happening now, and what's happened previously. Here's what I think everything is best for:
- DHT22 Humidity: Trends
- DHT22 Temperature: Current readings and trends
- TGS2600: Trends
- LDR (GL5528): Trends
- UVI-01: Current readings and trends
- BMP085 Pressure: Current readings and trends
- BMP085 Temperature: Trends
I suspect that overall what's going to be really exciting is looking at magnitude of change over time, rather than looking at specific values. Stay tuned to see what my room has been like since I built the AirPi!