A what? A rain gauge. It counts the depth of rainfall per unit area. So it might report that over the last 24 hours there were 2 mm of rainfall per meter squared. Over an area the size of Sheffield (around 300 km^2), that translates to 600,000 cubic meters or on the order of 240 Olympic size swimming pools. That sounds like a lot, but realistically when you consider that the River Don is 110 km long, that volume of water isn't so much. The floods here in June 2007 were the result of over 200 mm of rainfall in two weeks. 60,000,000 m^3 for just Sheffield, combined with the much greater surrounding area... Now we can see why having a rain gauge might be interesting.
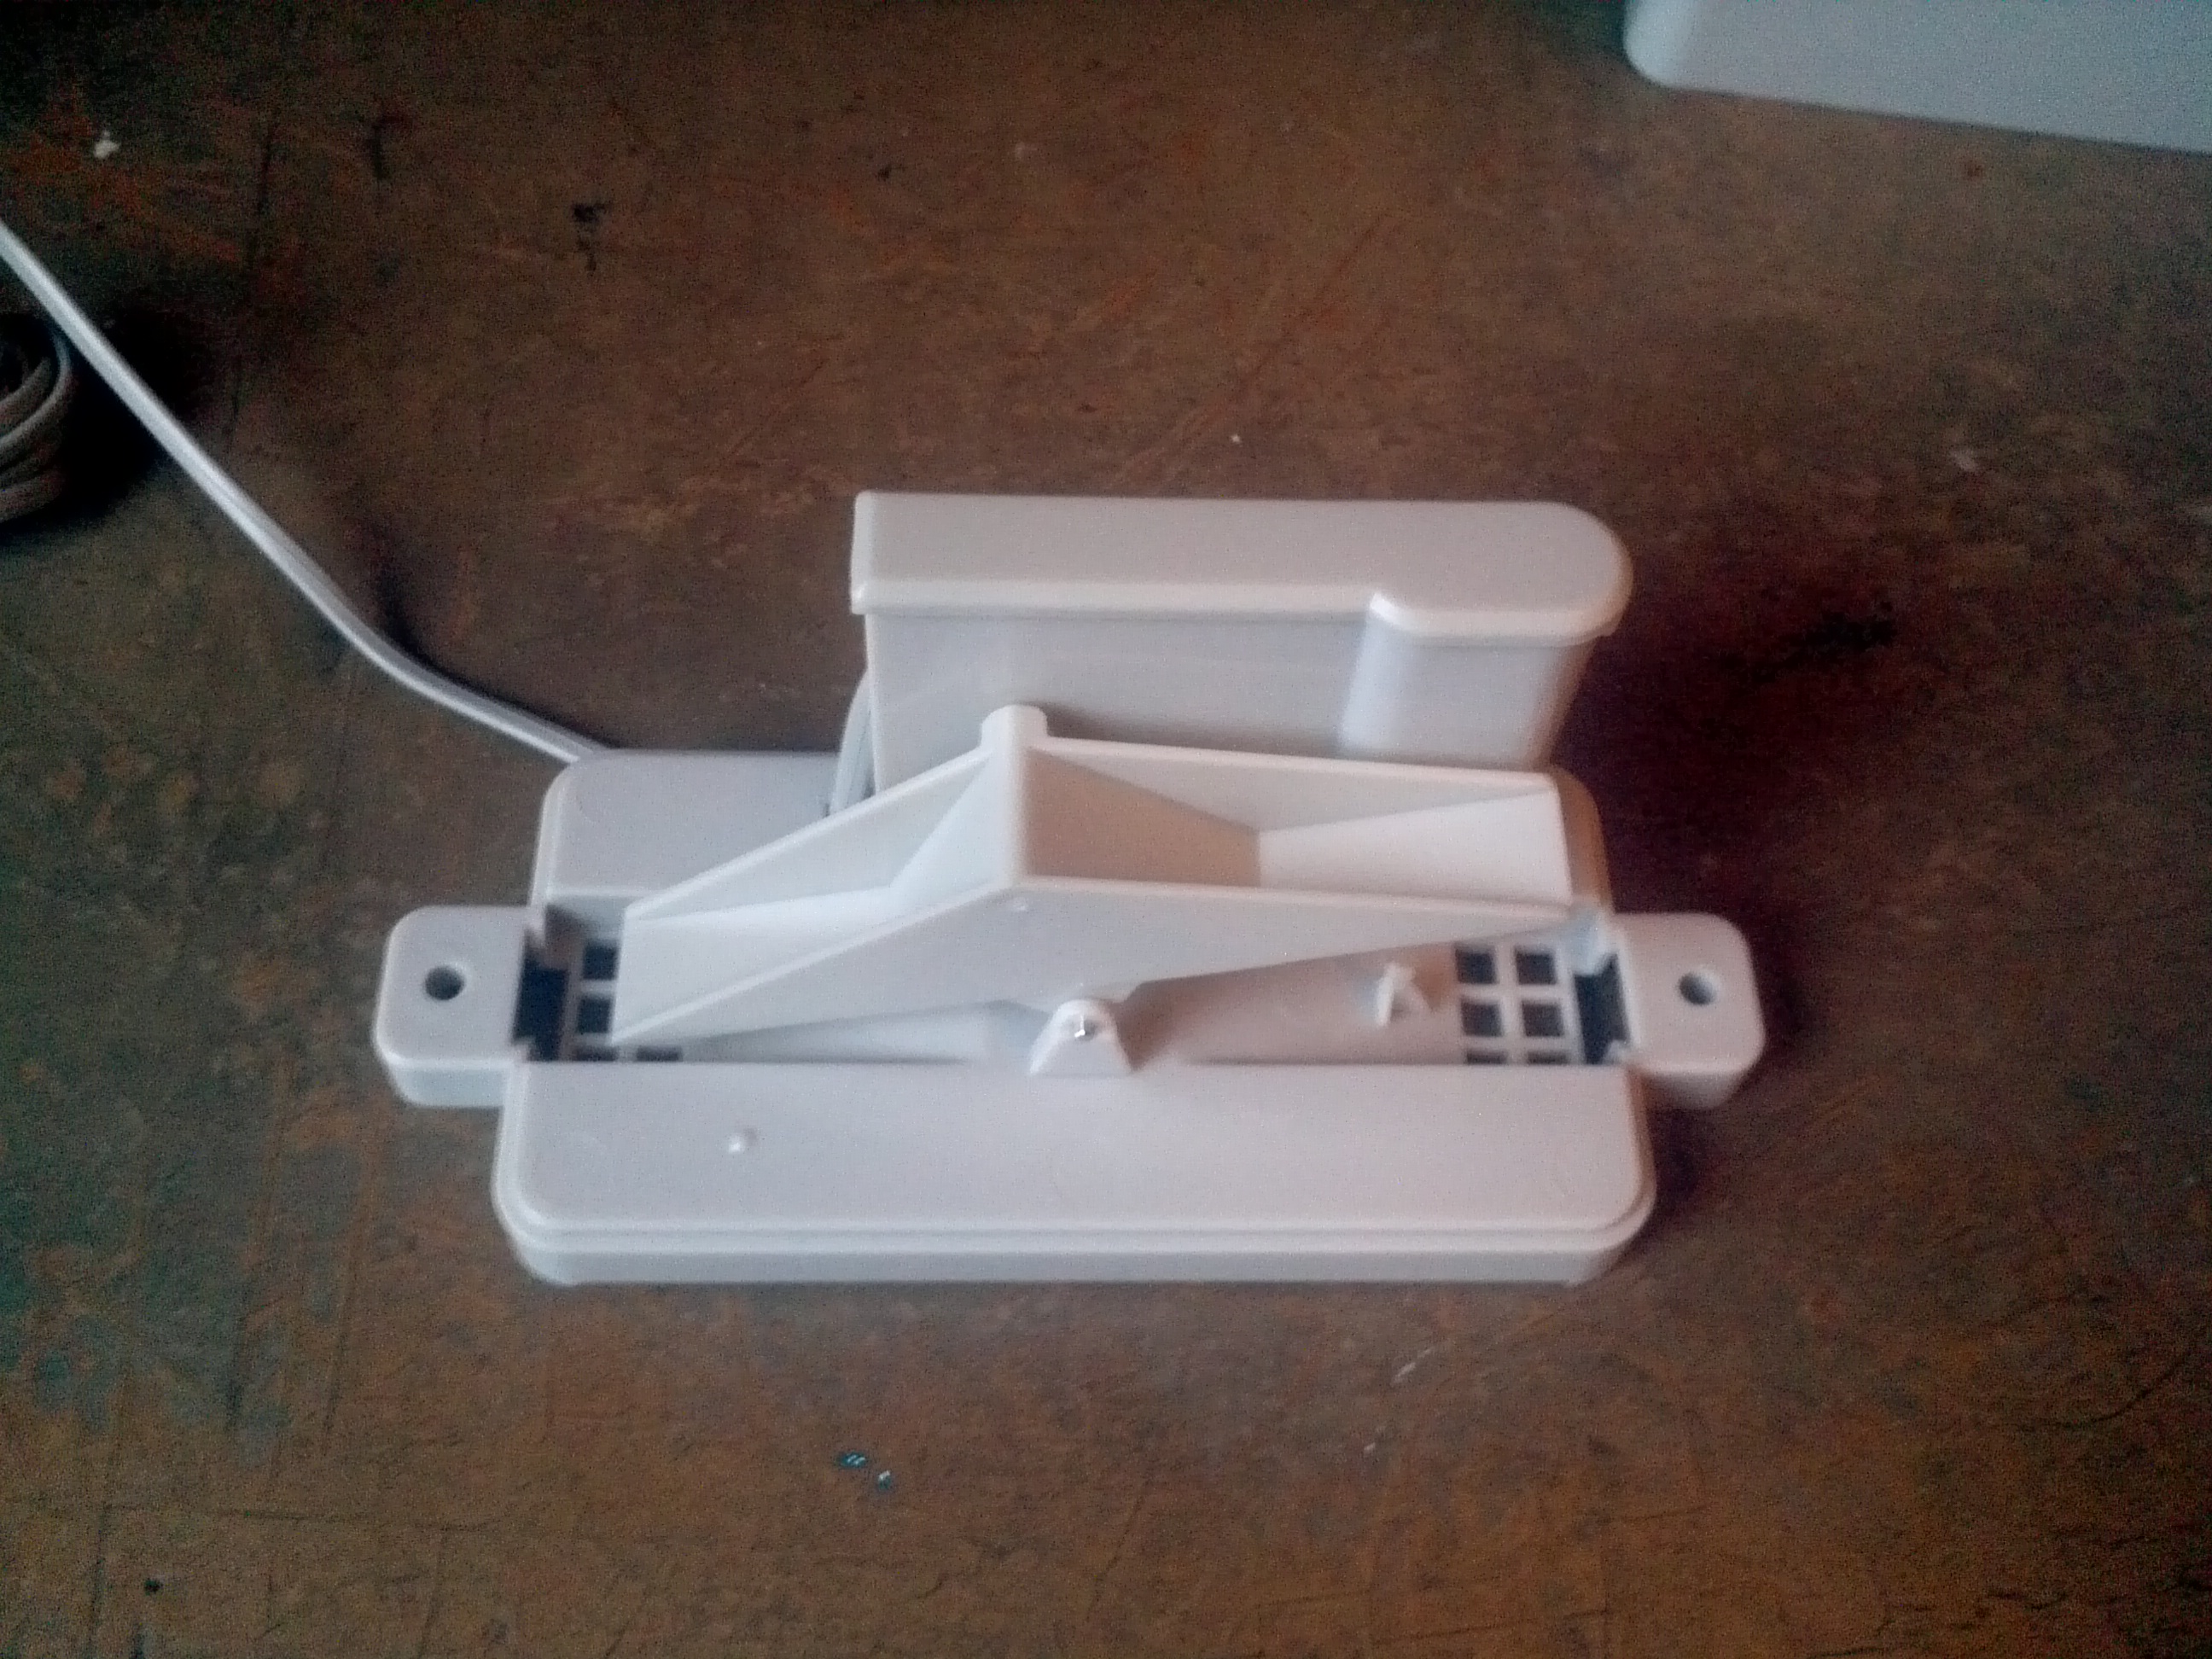
So how does a rain gauge work? There are a few different types, but most common and what I've got is called a tipping bucket rain gauge. Basically there's a little see-saw inside. The rain fills up a bucket on one end and it tips over so that it empties and the bucket on the other side starts to fill. Each time the bucket tips it passes a magnet over a reed switch making a momentary electrical connection. The buckets are calibrated to a volume of water, which means if you can count how many times the switch closes you know how much rainfall there's been.
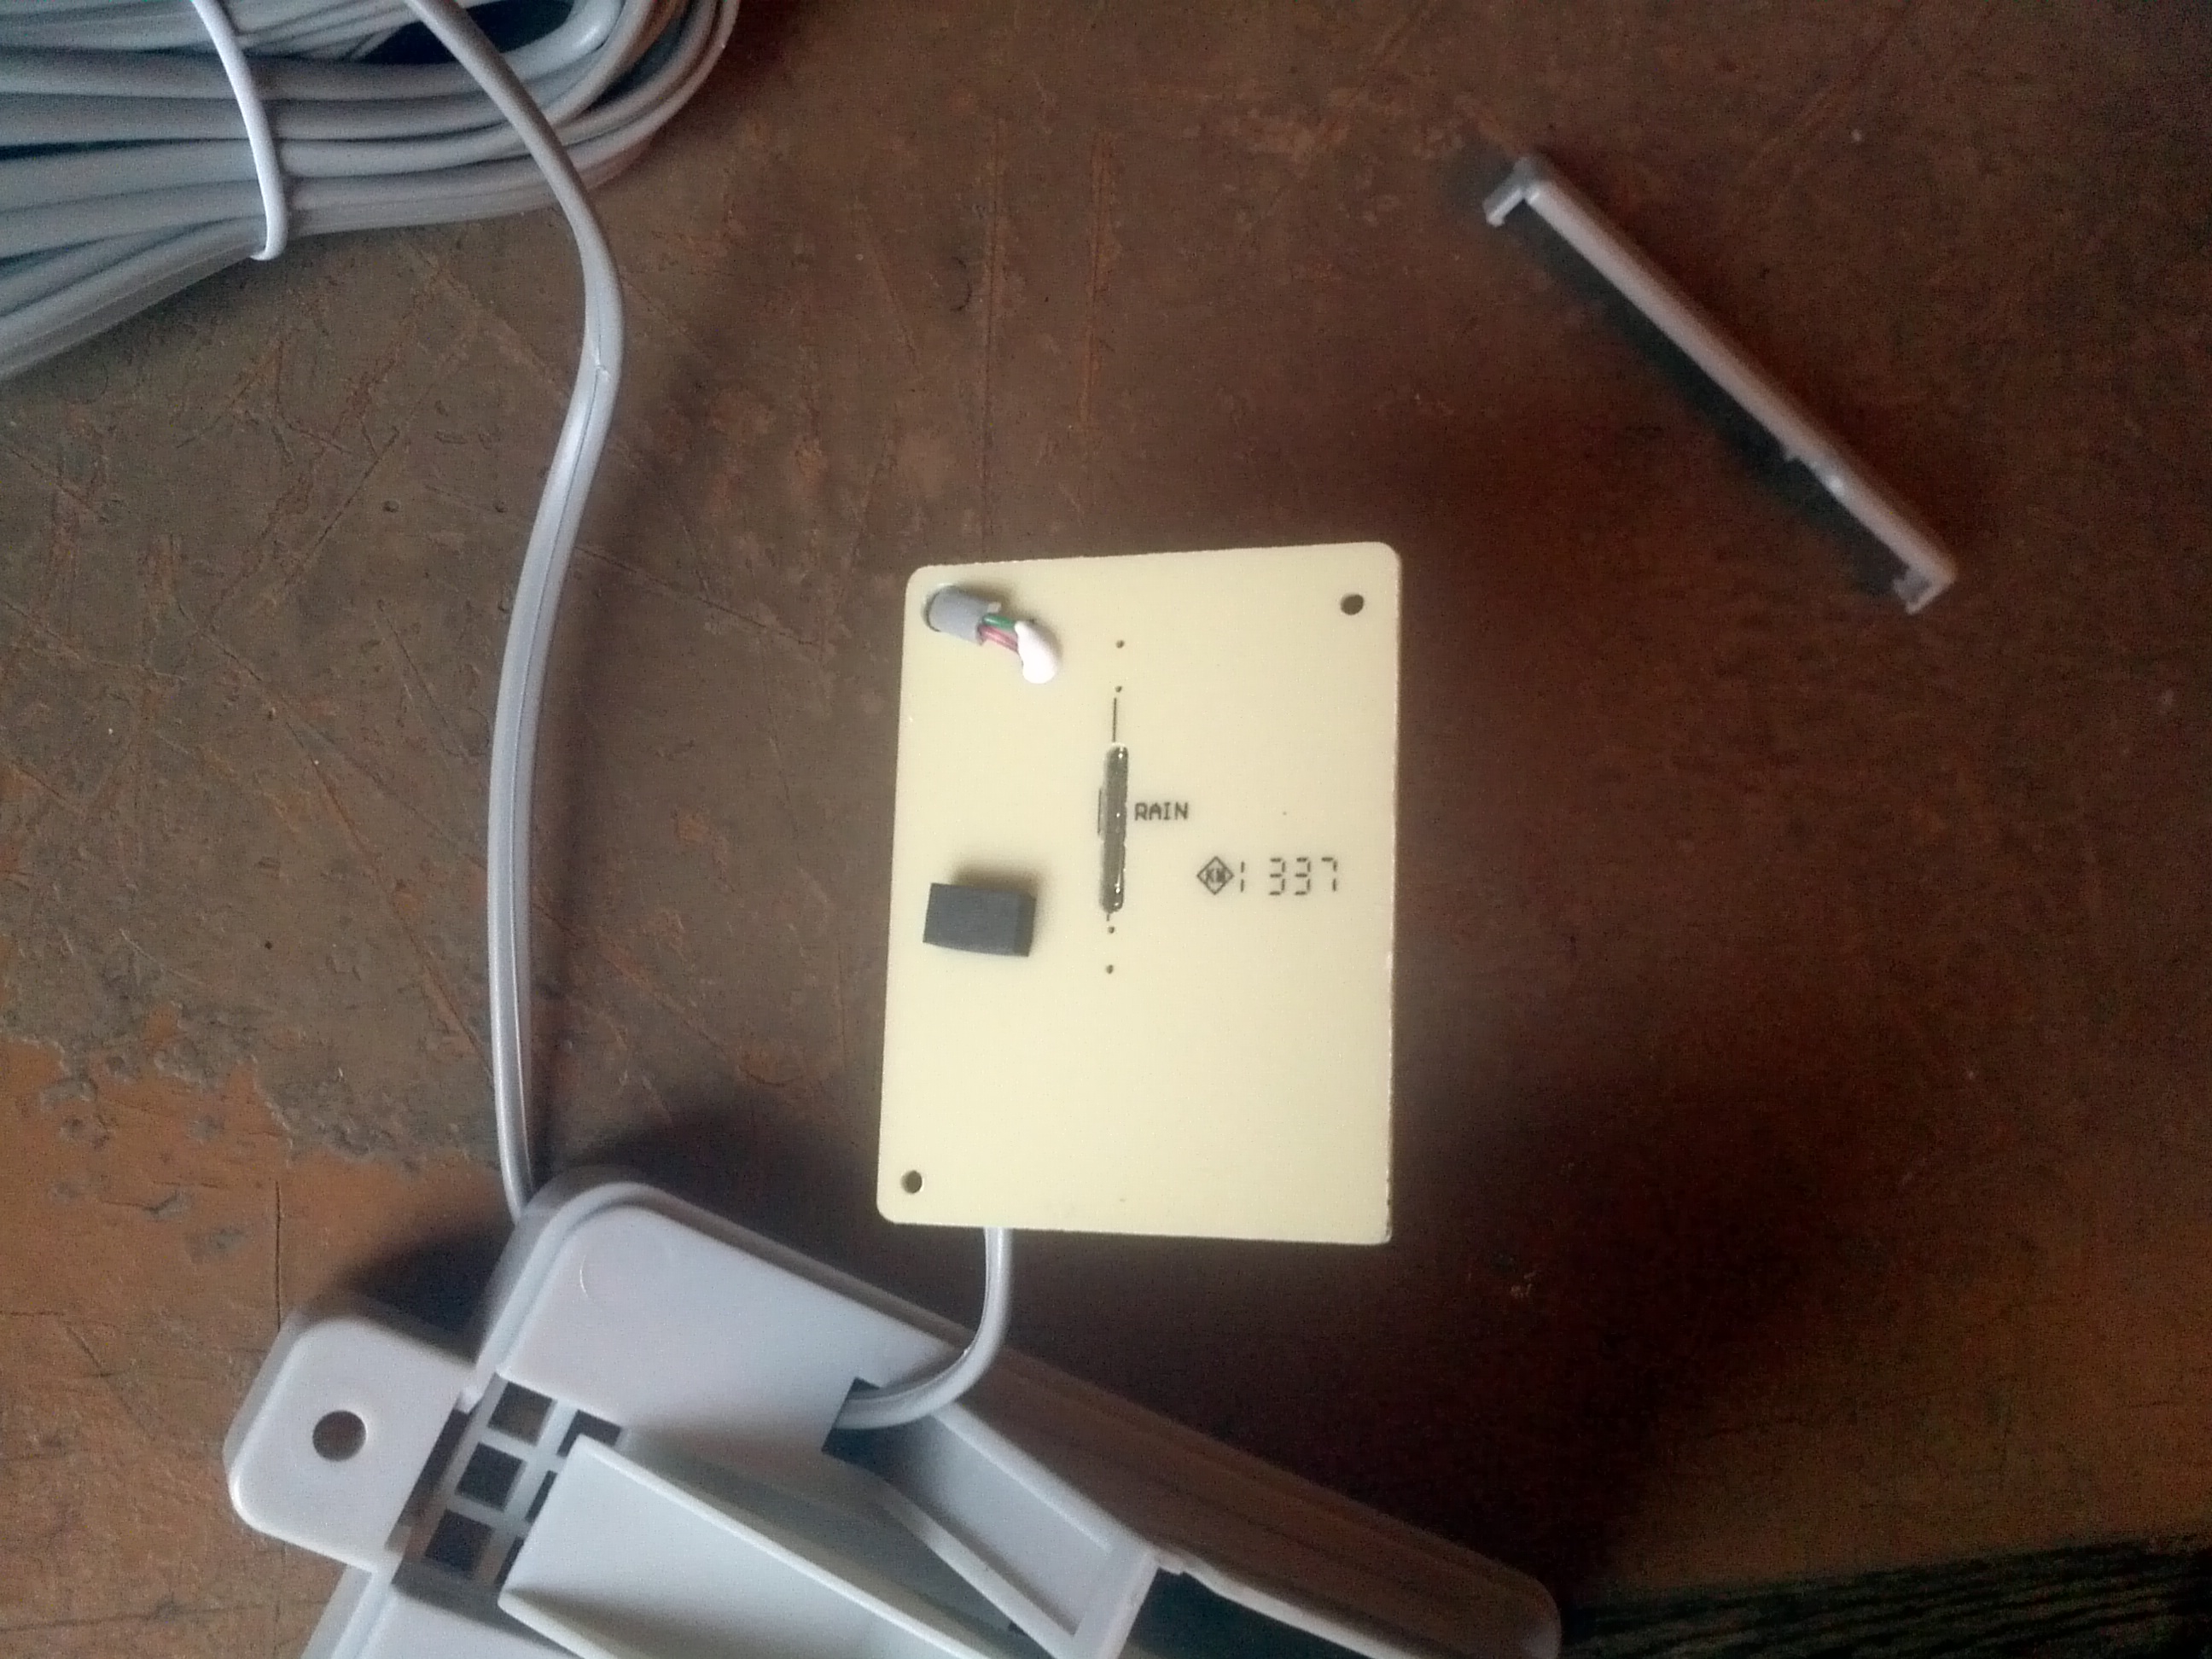
The rain gauge I've been showing here is one you can have for a fiver from Maplin. It has an RJ-11 plug on the end you'll probably need to cut off to connect it to the Pi. Still, This suprisingly low cost means anyone can have a play at weather monitoring, and personally I've always found rain to be pretty neat. Onwards!
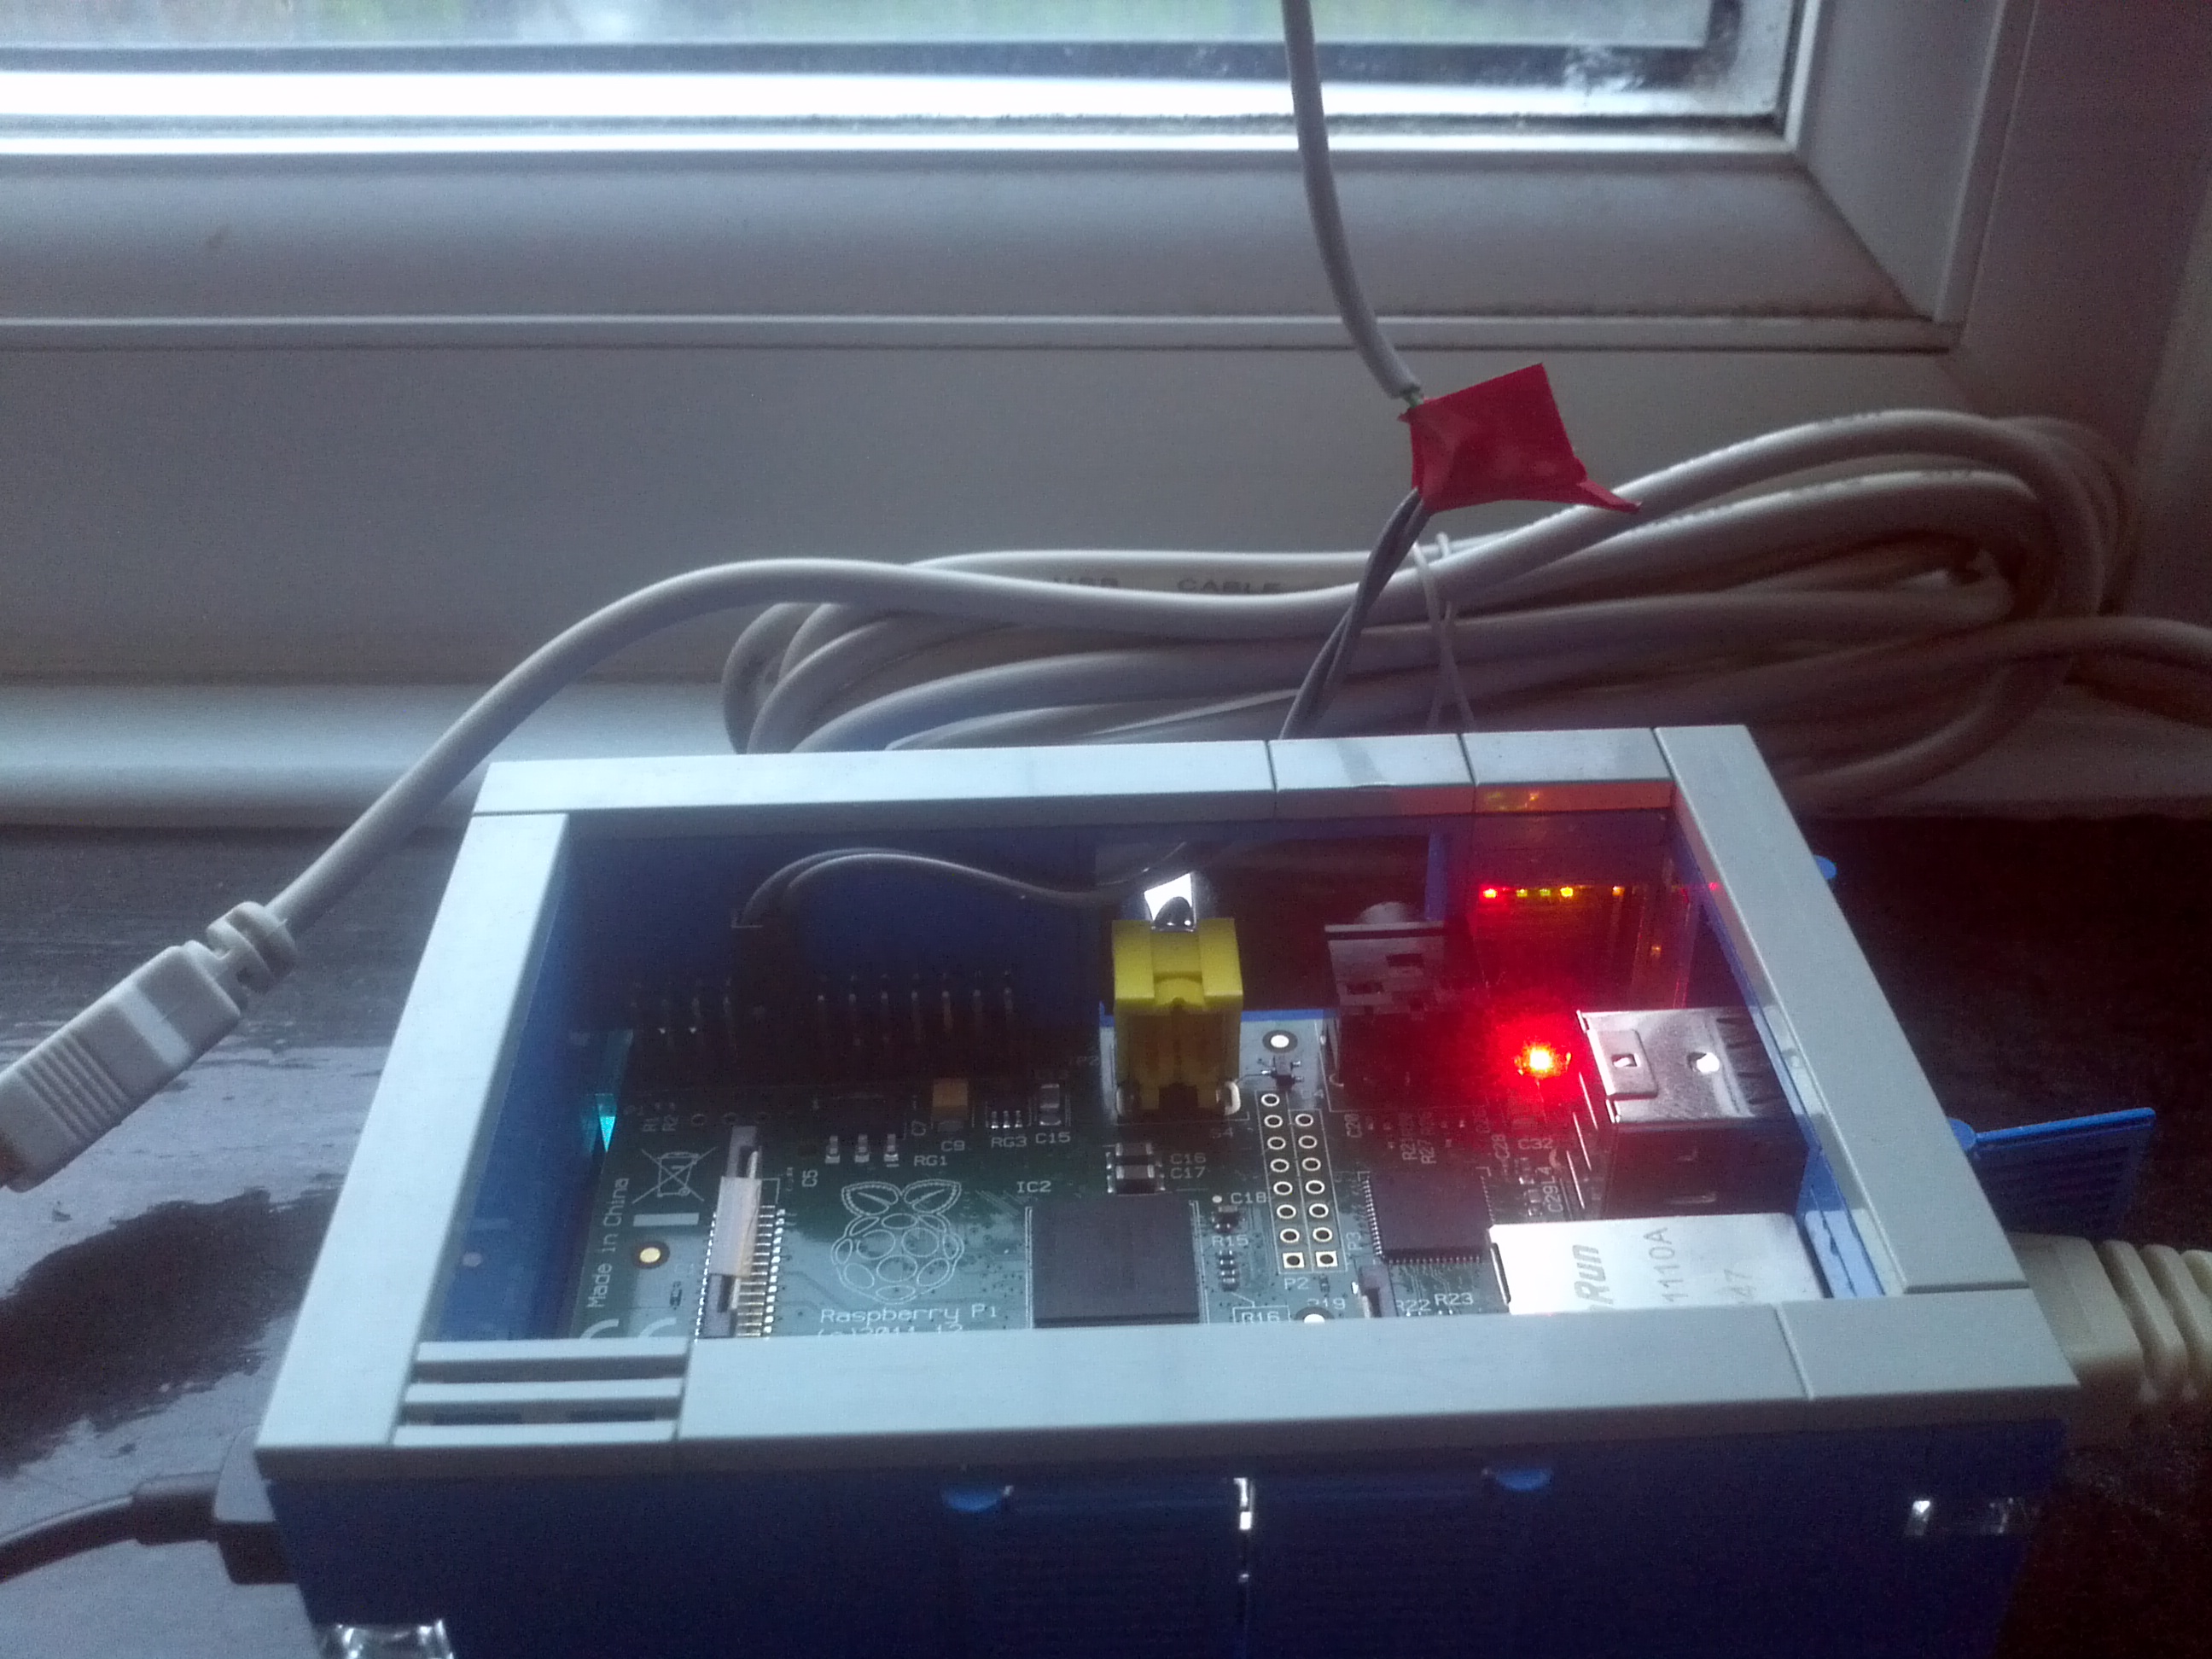
Basically what it boils down to is that each tip of the bucket in the rain gauge is identical to a button press. We can easily then connect the gauge as if it were a button. I've connected mine to ground and GPIO 17. After that all we need to do then is to monitor for button presses which is pretty straight forward. It can be done two ways. A continuous loop can run checking the value of the GPIO. This is pretty resource intensive. Or we can use GPIO interrupts, similar to what I did in the 3D project. This is where closing the circuit (pressing the button, the bucket tipping) triggers a software event.
Fortunately RasPi.TV has written a quite nice article on how to use interrupts with Python. The RPi.GPIO function library has a simple call to register listening for interrupts on a given PIN: GPIO.add_event_detect. This makes it dirt simple to create a monitoring program. I've uploaded the code I've written to GitHub, but I'll go over the important bits here.
GPIO.setmode(GPIO.BCM)
GPIO.setup(PIN, GPIO.IN, pull_up_down=GPIO.PUD_UP)
This is pretty standard and if you've done any GPIO work before you should recognize it as initializing the GPIO. The setup function here tells the system we'll be using PIN (17) for input, and that we should use it in pull-up mode. That is to say, we connect the internal resitor attached to the pin to +3.3 V. This allows it to be clear when the rain gauge closes the circuit to ground that there's been a change.
# variable to keep track of how much rain
rain = 0

# the call back function for each bucket tip
def cb(channel):
	global rain
	rain = rain + CALIBRATION

# register the call back for pin interrupts
GPIO.add_event_detect(PIN, GPIO.FALLING, callback=cb, bouncetime=300)
We have a variable rain that is a counter for the amount of rainfall. We then have a function (cb) that adds the bucket amount to it, the CALIBRATION variable which for this gauge is 0.2794 mm per tip. The add_event_detect function then sets up the interrupt listening on PIN. Because we've set the pin in pull-up mode, we're listening for a falling edge, that is the transition from +3.3 V to 0 V. When this occurs we'll call the callback function cb. The bouncetime specifies that the cb can't be called any more frequently than once every 300 ms. This prevents counting a rapid alteration between switch states, called bouncing.
The program output is a CSV log file which in column A has a unix timestamp, and in column B has a rainfall amount. I've set it up to log every 5 seconds, but really that can be a much longer minute or 5 minute interval even. I like the higher frequency because if it's raining really hard, you can't catch small temporal variations with a longer monitoring frequency. It's easy in comparison though to go from 5 second to 5 minute readings.
The other thing to bear in mind is that how the program is that while the bucket in the gauge fills up slowly, you only get an instantaneous result. There won't have been 0.2794 mm of rain in the last 5 seconds, but instead it will have occured in the interval since the last reading. This is a post-processing consideration if you're interested in producing rainfall over time graphs, but isn't an issue for totals.
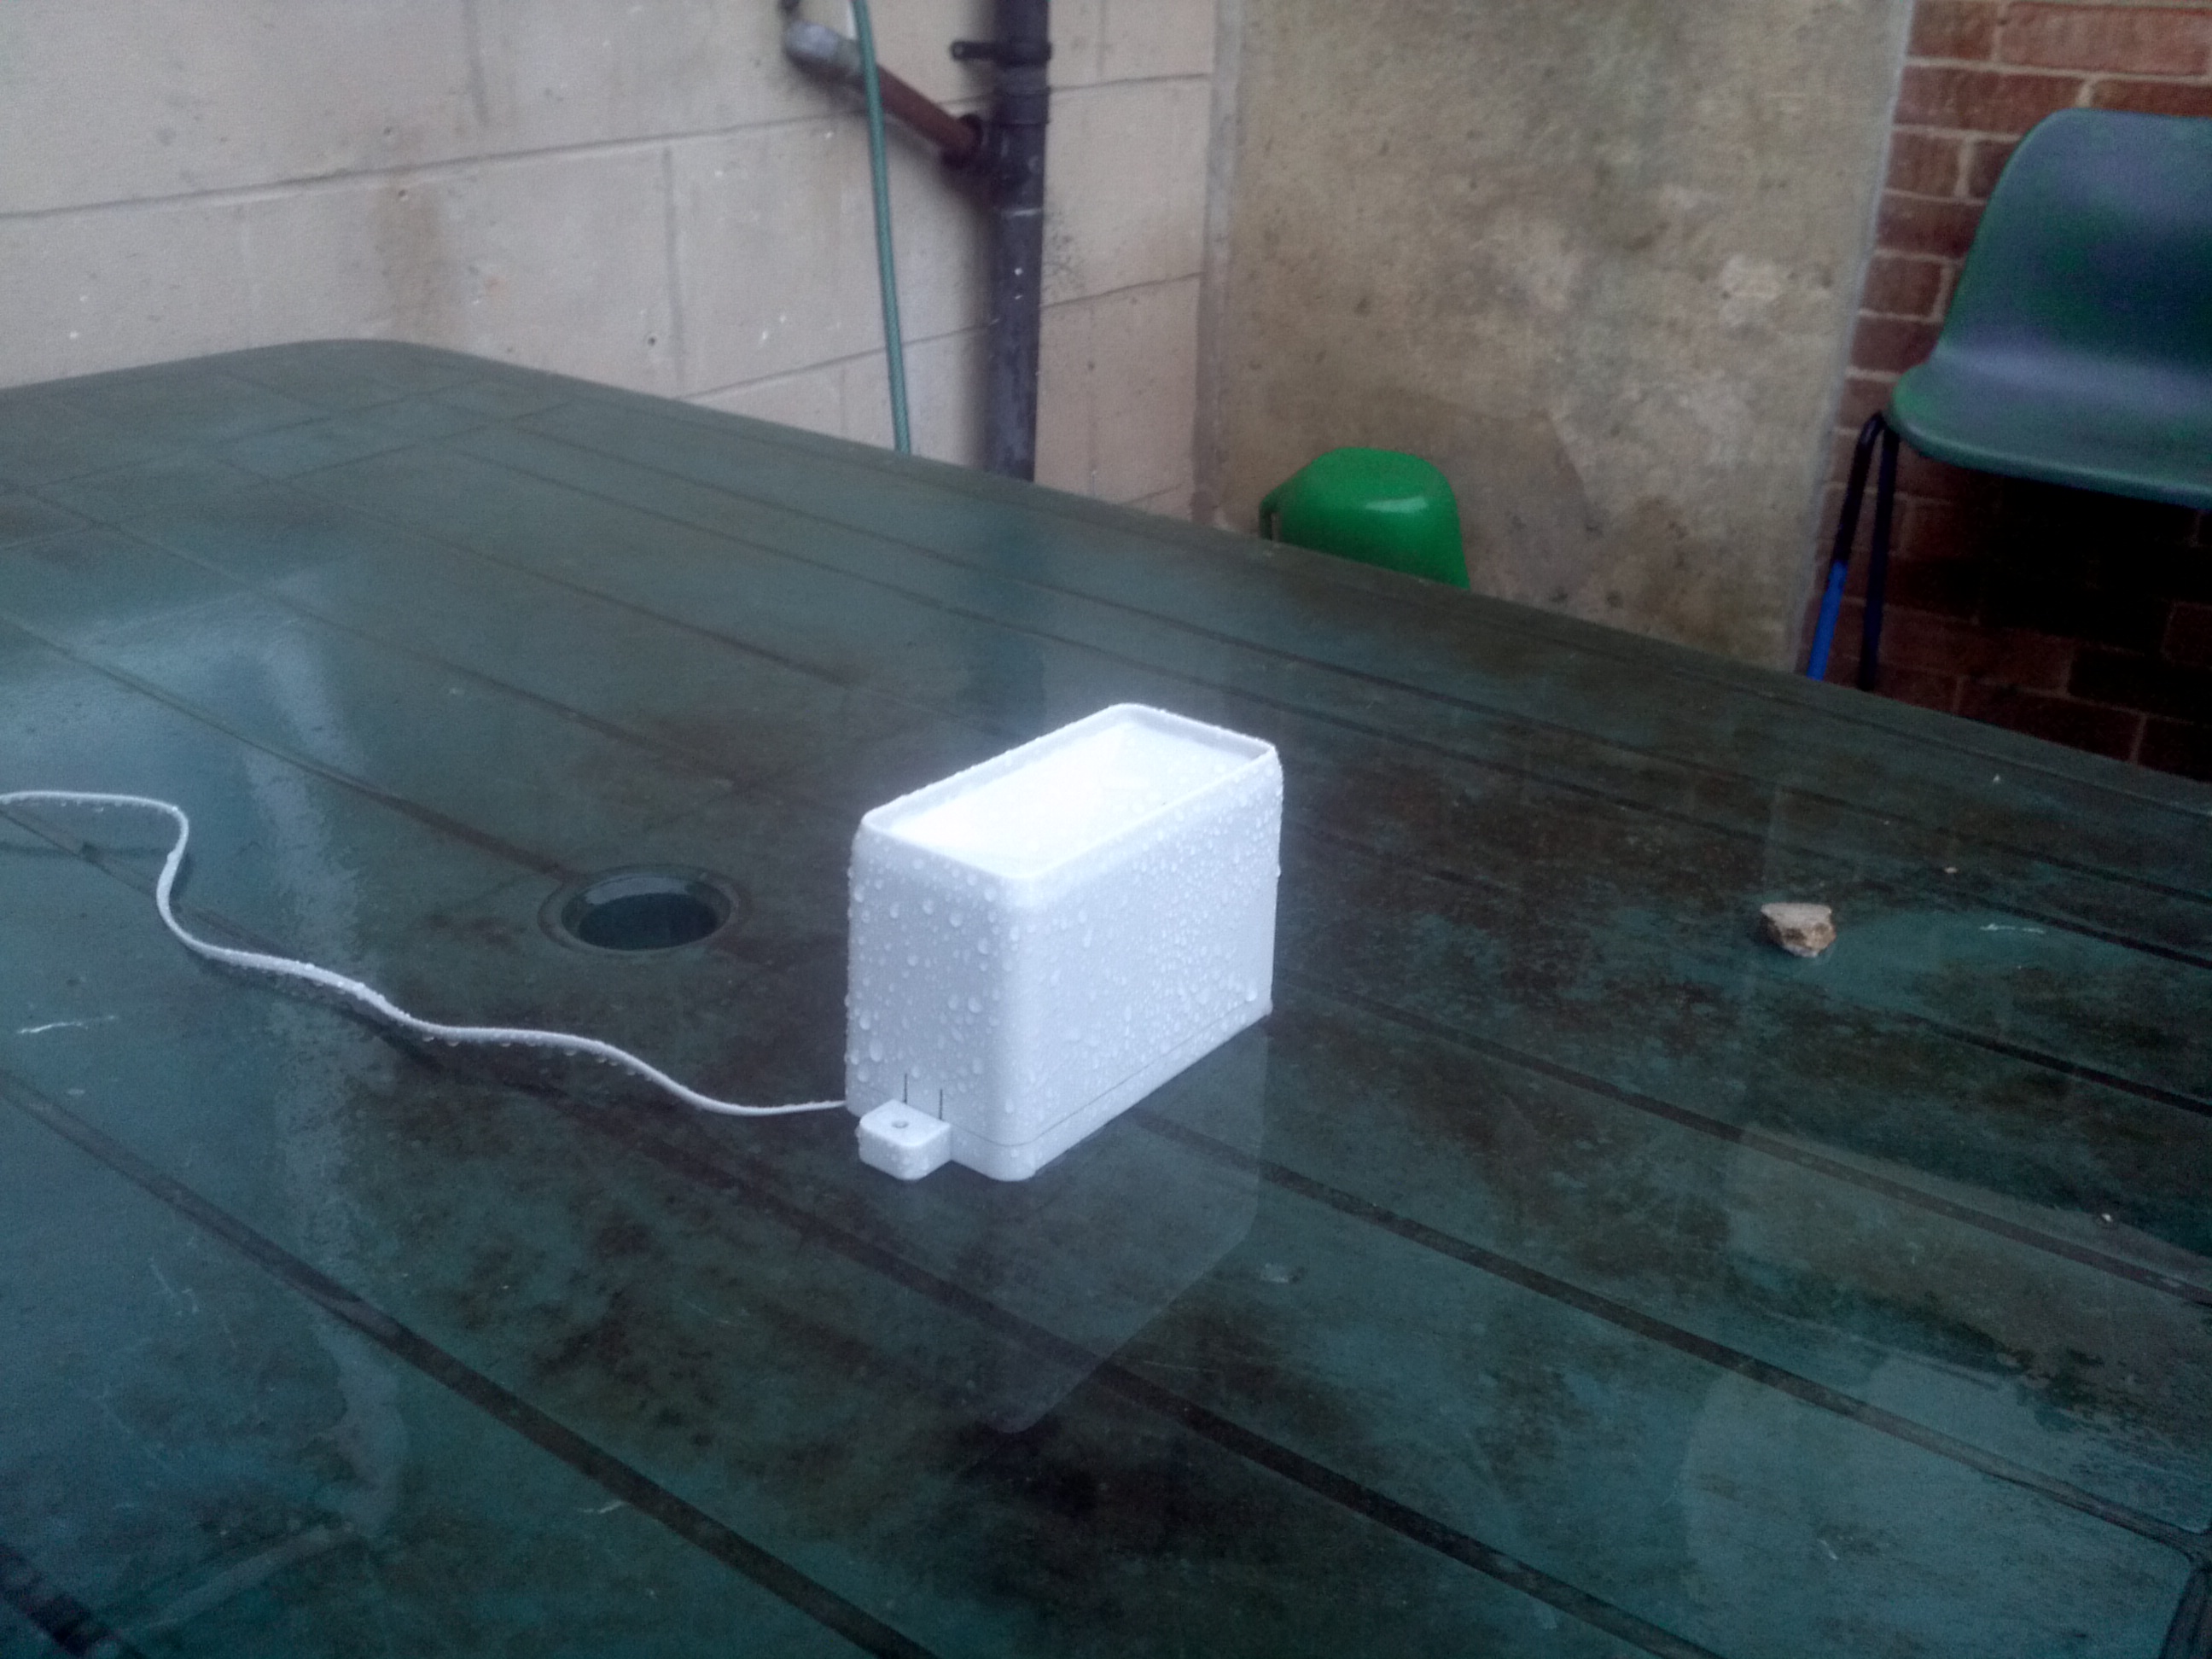
Some minor comments about rain gauge placement. Higher is better. They should be secured, and outside of what's called a building's shadow. Rain can be carried by the wind and if the wind is coming from the other side of the building the reading's likely to be off. Bearing all that in mind, I can't meet any of those conditions properly. My rain gauge is at least outside though. Let's look at some of the data. (I've plotted it quickly using Octave.)
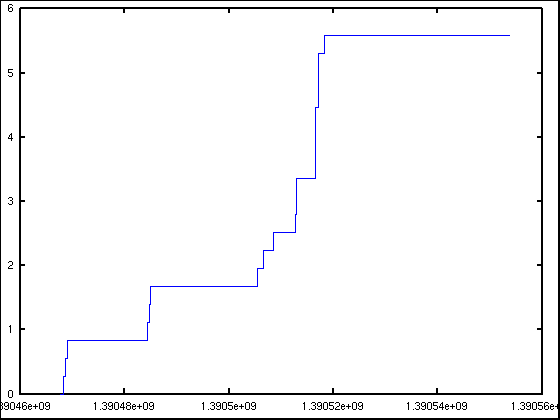
There are some teething problems. The above graph goes from 0900 on the 23rd to 0900 on the 24th. I know for a fact there was no rainfall that evening. Indeed, it was dry as a bone and most small puddles had evaporated. I suspect maybe that the wind or cold weather was having an effect, but I'm really not sure. In the meantime I'm keeping an eye out for false readings. Maybe an interrupt bug?
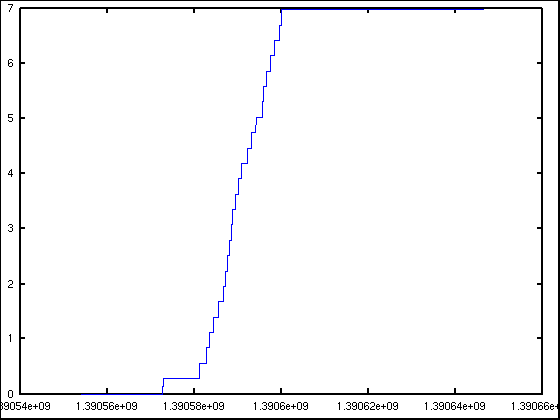
Ignoring them, the data is actually pretty good. According to this figure, last night (from around 1700 to 2200) we had around 7 mm of rainfall. That's a fairly average rainfall and I actually remember it happening. The value also compares favorably to other rain gauges I have access to. They're a few km away and reported 6 to 6.4 mm of rainfall.
As a fun project if you're in Sheffield, you can compare how much rain you're recording to the Weston Park Museum's weather station! There are other monitoring stations around the country and world a little bit of Googling should help out there.